

To celebrate the most thrilling time of the year, we gathered some advanced xG statistics from the 2022–23 hockey season.
In short, expected goals (xG) statistics evaluate the quality of shots. xG sum shows how many goals a player or team was statistically likely to score, which often differs from the scored goals in reality. This makes xG statistics a great tool for evaluating a team’s or player’s shooting efficiency during an entire game or several games. xG predicts a player’s or team’s ability to score goals and prevent the opponent’s goals better than any other single metric
For example, if the scored goals correspond with the xG sum of a player, the player has been effectively shooting, creating scoring chances and preventing the opponent’s chances to score.
Our xG model takes into account not only a shot’s distance and angle but also what happens before and during the shot: passes, lateral movements, screens and goalkeeper position.
Interested in seeing more Wisehockey and Wisesport data? Check out the websites and social media of the German DEL, the Finnish Liiga and Norwegian Elitehockey and their clubs. Don’t forget to follow us on Instagram.
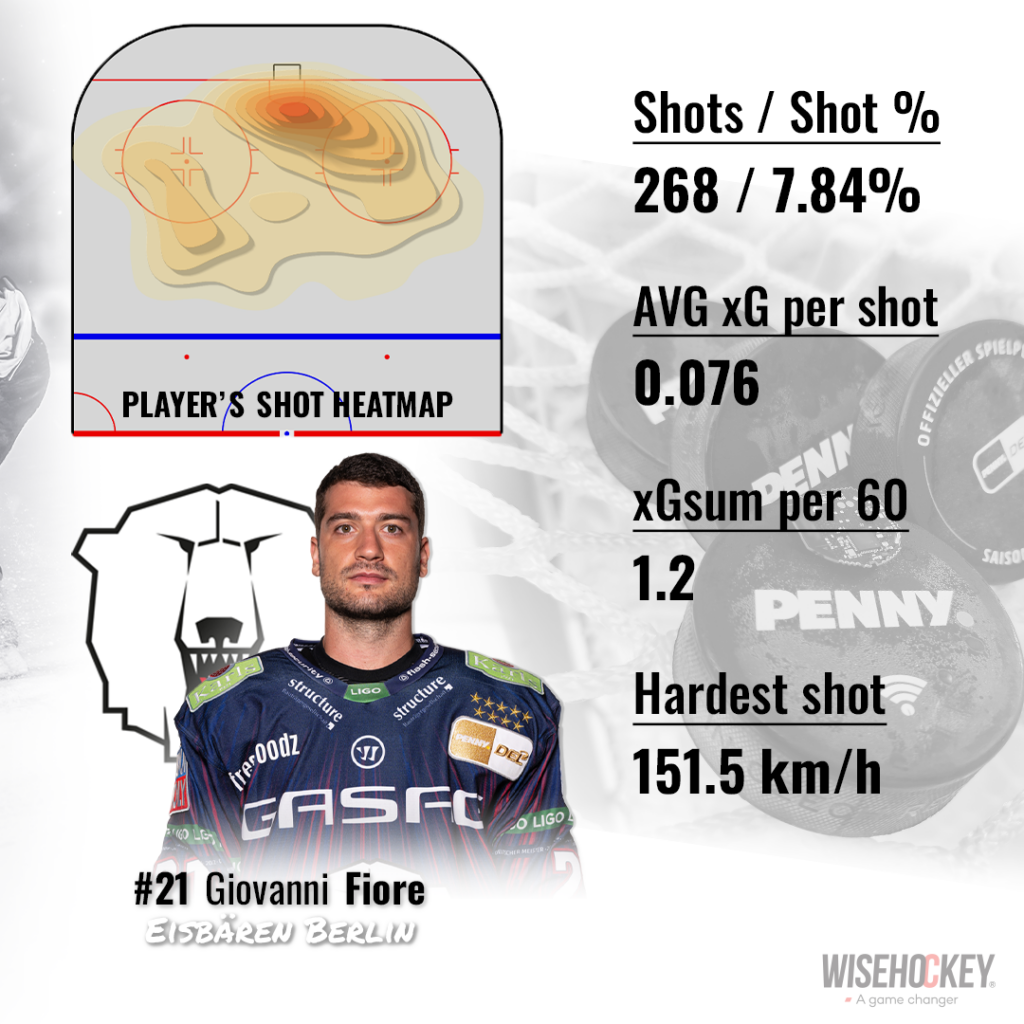
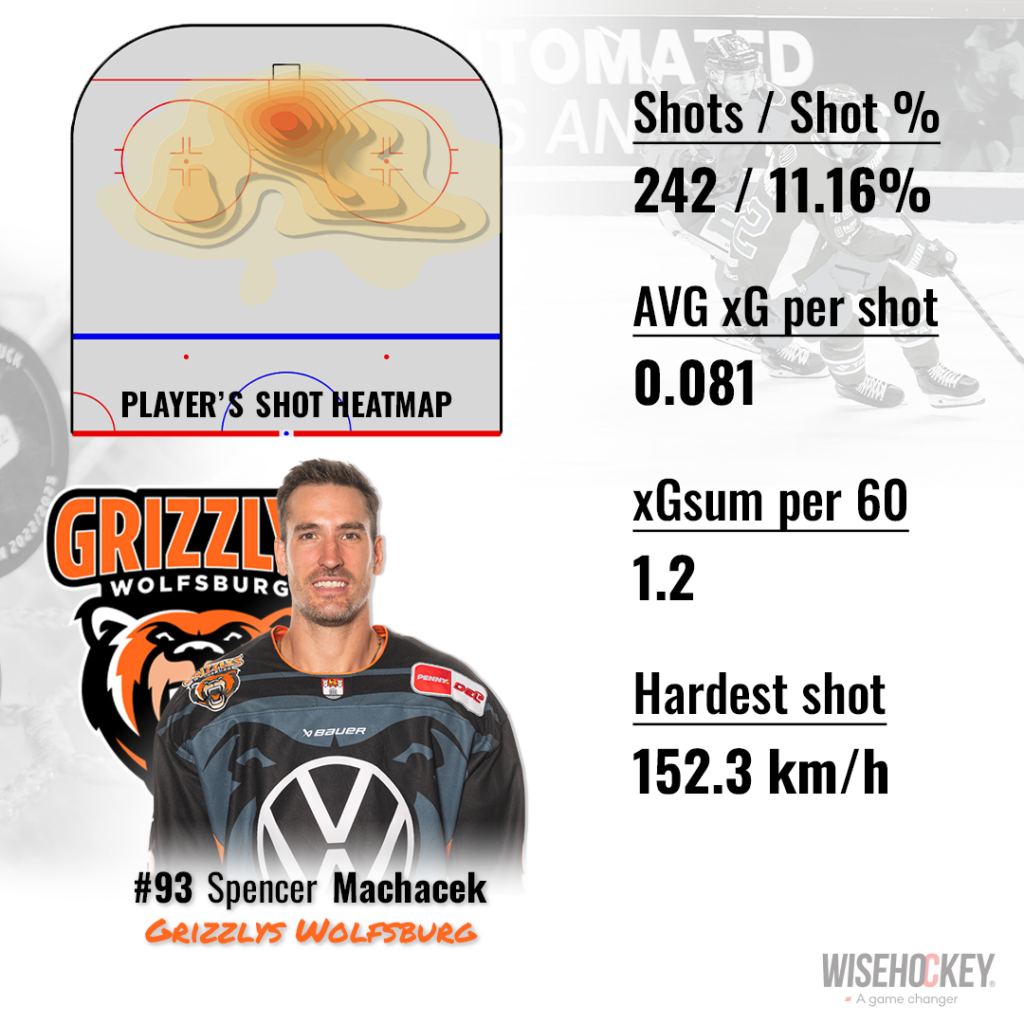
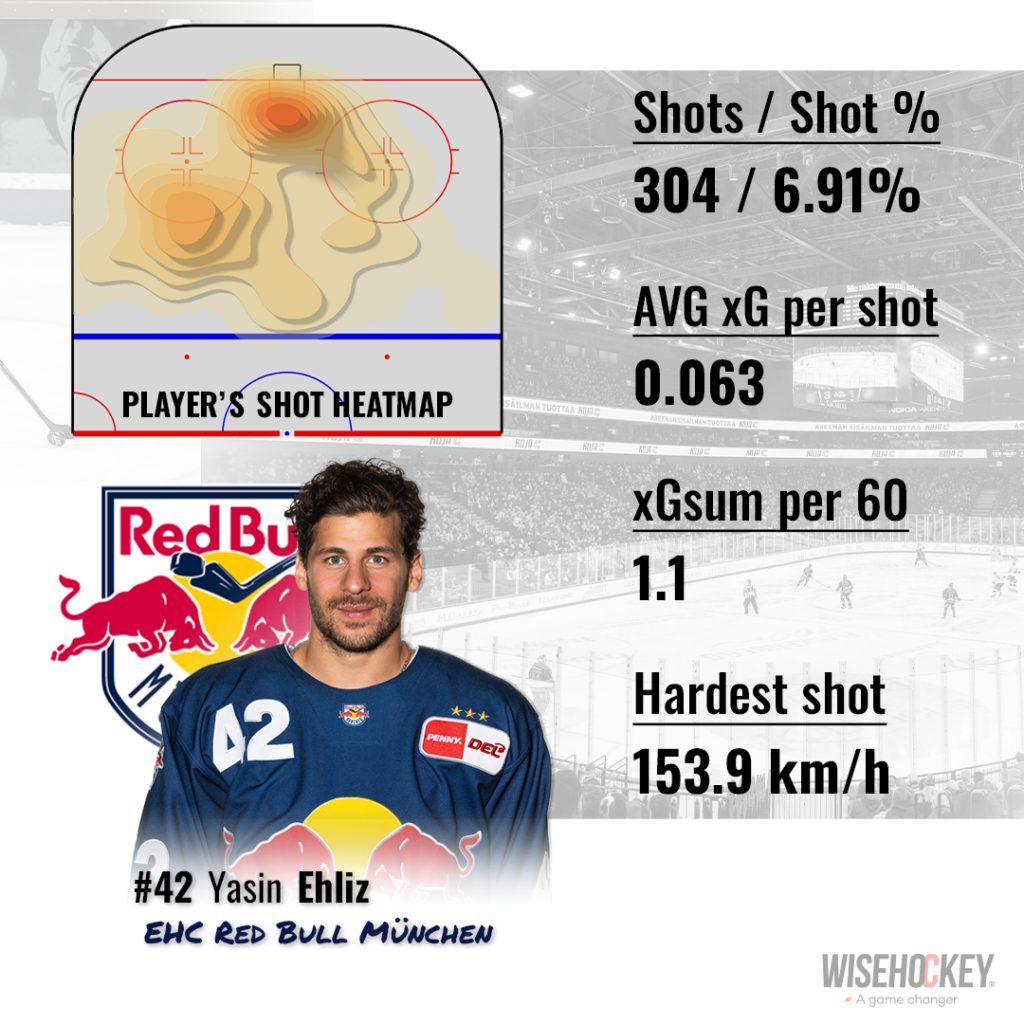
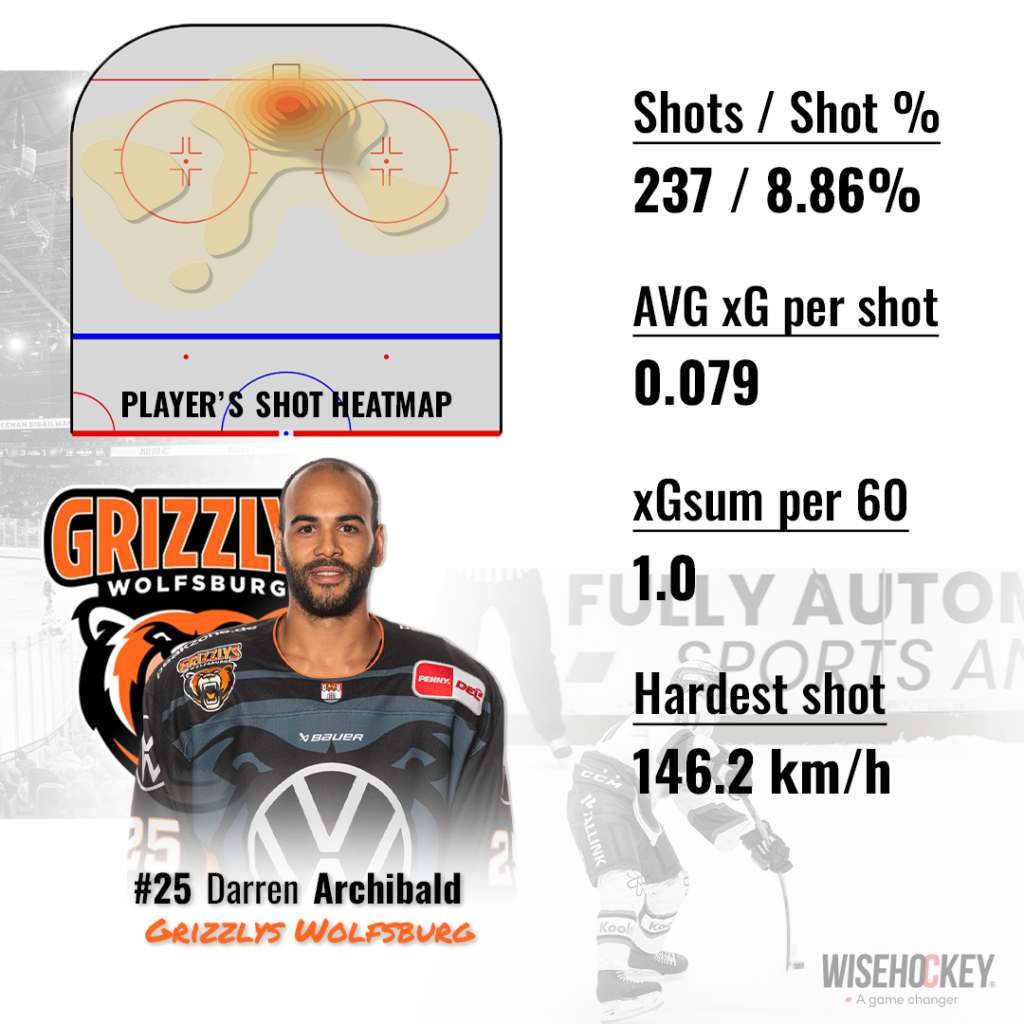
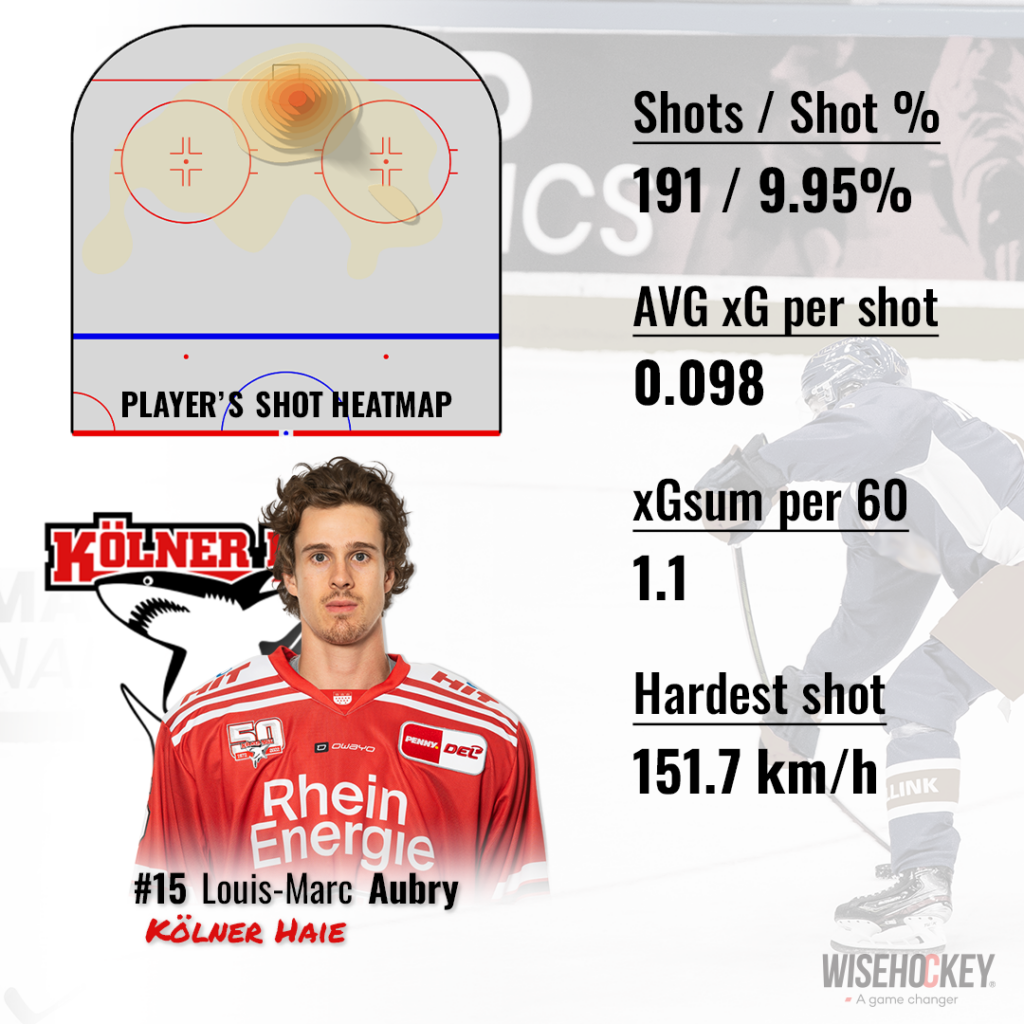
Top five xG ranking in DEL
Check out which five DEL players generated the most xG during the regular season:

Top five xG ranking in Liiga
These five Liiga players were the best in xG statistics during the regular season:
Top five xG ranking in Norwegian Elitehockey
Finally, get to know the top five Elitehockey players who generated the most xG: